Briqueterie Jbel Annour Fabricant de solution durable en terre cuite
Situé à Mohammedia, Jbel Annour est le spécialiste de la fabrication des briques rouges, doté d’un savoir-faire inédit et d’une capacité de production colossale
Briqueterie Jbel Annour Fabricant de solution durable en terre cuite
Situé à Mohammedia, Jbel Annour est le spécialiste de la fabrication des briques rouges, doté d’un savoir-faire inédit et d’une capacité de production colossale
Briqueterie Jbel Annour Fabricant de solution durable en terre cuite
Situé à Mohammedia, Jbel Annour est le spécialiste de la fabrication des briques rouges, doté d’un savoir-faire inédit et d’une capacité de production colossale
A propos de
JBEL ANNOUR
Briqueterie Jbel Annour
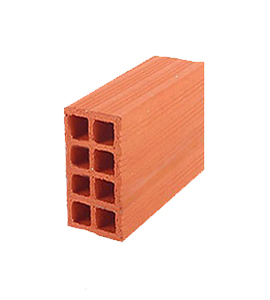
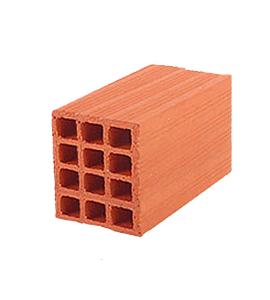
BRIQUETERIE JBEL ANNOUR offre à sa clientèle une large gamme de produits en terre cuite : la famille de briques creuses (brique 8 trous ; brique 6 trous ; brique 12 trous et brique 3 trous)
Isolation thermique accrue
Réduit les dépenses énergétiques, freine la déperdition de chaleur entrainant une réduction des factures énergétiques
Calibrage des dimensions
régularité dimensionnelle et calibrage optimisé permettant une durabilité optimale et très peu d’entretien
Développement durable
La brique est moins polluante que le parpaing, conçue en terre cuite 100% naturelle
L’impact environnemental
Son bilan carbone est positif, notamment grâce à son fort pouvoir isolant . Le passage de la terre crue à la terre cuite est une transformation qui nécessite de l’énergie thermique et dégage du carbone (CO2)
Amélioration continue
Passer d’une approche curative (au mieux, réactive) à une gestion préventive et surtout proactive jbel ANNOUR s’engage a offrir les meilleurs conditions de travail a ses salariés, satisfaire davantage les clients et les fidéliser et bien sur améliorer l’efficience de l’organisation
Recyclage
94 % des déchets de terre cuite sont revalorisés : 55% en comblement, remblaiement, stabilisation de routes, chemins, ou encore terrain de tennis et les 39% (briques et tuiles) sont recyclés
20+
Ans d'experience
400+
Collaborateurs
800+
Tonnes/Jour
Une large gamme de produits
Avez-vous besoin d'un devis ?
Nous vous répondrons dans les plus brefs délais.
Les valeurs de JBEL ANNOUR
01.Respect environnemental
Une utilisation raisonnée des énergies et des ressources naturelles : prélever de manière raisonnée les ressources, utiliser des ressources renouvelables, favoriser le réemploi, la réutilisation, le recyclage, choisir des solutions offrant une durée de vie adaptée.
02.Transparence
En rendant accessibles certaines informations aux collaborateurs et au public, les dirigeants de JBEL ANNOUR assument les responsabilités de leur entreprise et veillent à ce que chaque mesure prise soit dans leur intérêt.
03.Diversité
JBEL ANNOUR encourage à la diversité et met un point d’honneur a lutter contre les stéréotypes et la discrimination au sein de ses murs et dans le secteur global.
Ce que disent nos clients
“El. Youssef” Responsable achat
Les briques en terre cuite de Jbel Annour sont tout simplement exceptionnelles. La qualité du produit est remarquable, et le service client rapide et efficace a rendu mon expérience d'achat des plus agréables. Je recommande vivement cette société pour ses produits de première classe et son service impeccable
“Mo. Laila” Directrice d'entreprise
Les briques de Jbel Annour sont non seulement d'une qualité remarquable, mais le processus d'achat a été fluide et le service client exemplaire. Une expérience globale très positive, je recommande vivement cette société pour sa fiabilité et son produit exceptionnel
“Fe. Ghizlane” Chef de chantier
Les briques en terre cuite de Jbel Annour ont dépassé toutes mes attentes. Qualité exceptionnelle, livraison rapide et service client impeccable. Je recommande chaudement cette entreprise pour tous vos besoins en briques de haute qualité
“Na. Saad” Directrice d'achat
Mon expérience avec Jbel Annour a été exemplaire. Les briques en terre cuite sont d'une qualité exceptionnelle, la commande a été traitée rapidement, et le service client est tout simplement irréprochable. Je recommande vivement cette société pour son professionnalisme et la qualité de ses produits
Nos derniers actualités
Nouvel An Hégire 2024
Nouvel An Hégire 2024
Demandez votre Devis en Ligne
Devis en Ligne
Retour en image
Séminaire de certification des produits de constructions
Copyright 2024 © Jbel Annour. Tous droits réservés. Créé par Creative Network